Table of Contents
Performance Profiling
Here is the original document for the performance profiling of index.php (without executing other modules) profile.pdf.
Importance of Performance Profiling
If it is required to carry out a code optimization task, the developer should know about performance bottlenecks within the system. Otherwise the optimization process would be not effective. if we take the SAHANA system there are so many functions execute to deliver an output. To optimize the SAHANA system we should identify expensive functions those are worth optimizing. To identify expensive functions those may be bottlenecks a profiling exercise should be carried out.
To profile the system we use Xdebug(http://xdebug.org/) module and Kcachegrind (http://kcachegrind.sourceforge.net) visualization tool.
Performance Profiling Plan
We start the profiling task with SAHANA index.php file without requesting any other module. by doing that we expect to identify bottlenecks within the SAHANA framework and to present the information flow.
Then we profile each module separately to identify issues within those modules.
Profiling Index.php
When the index.php file is requested there will be so many functions executed. The following
diagram represents all functions.

In the above diagram empty rectangles mean there are no further functions execute within that function. We should filter out important functions those are worth optimizing.
It is important to select most expensive functions for the optimization process to make the
overall process effective. The following diagram show most expensive function in terms of memory
usage and time consumption.

In the above diagram the tab “self” indicates the time spent within the respective function. And the tab “incl” represents the time spent within the function with other child functions. So it displays the inclusive cost where as the “self” tab indicates the exclusive cost. The “called” tab represents the number of calls for the respective function.
As an example 16.42% of the cost is incurred within the handler_db.inc including its child functions. Direct functions within that script take 7.42% of the time.
By analyzing the above diagram we can say that most expensive segments for the index.php are within the handler_db.inc, HTMLPurifier, Open-Id and lib_config.inc, etc.
If we further analyze the execution we can determine most expensive parts as displayed in the
following image.
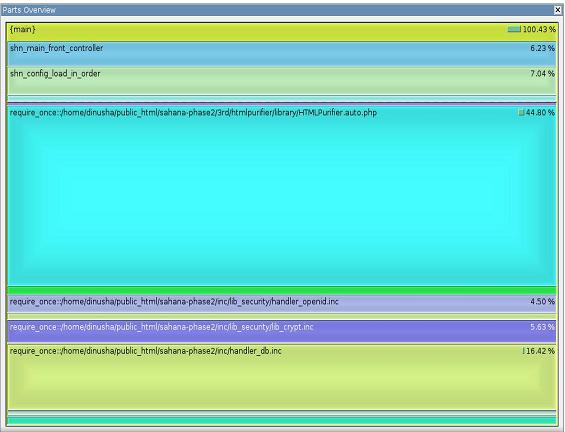
From the total execution time which is 100.43% (it is more than 100% since it shows the inclusive cost).
- HTMLPurifier takes 44.8%,
- handler_db.inc takes16.42%,
- shn_config_load_in_order() function takes 7.04%,
- shn_main_front_controller() function takes 6.23%,
- lib_crypt.inc takes 5.63%,
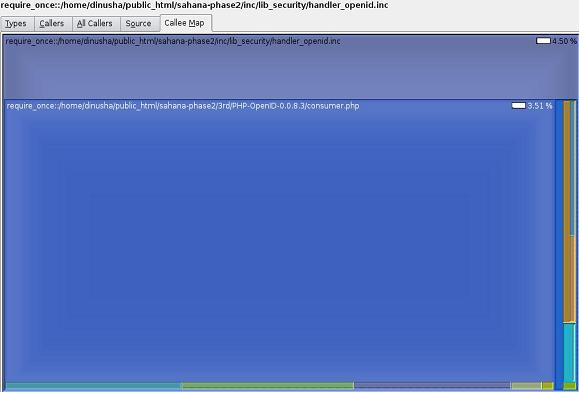
- handler_openid.inc takes 4.5%, of the process time.
So it is advisable to concentrate only on those parts when handling the optimization process.
The utilization of the process time can be further explained using the following graph:
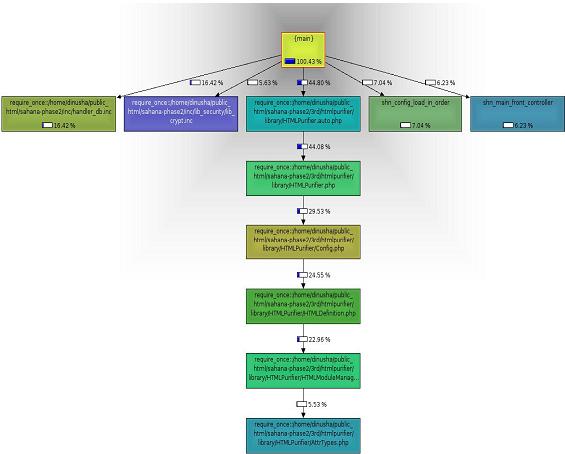
As it is clearly displayed the time is mainly shared among 5 parts listed above. And the HTMLPurifier has some more expensive segments.
Front Controller
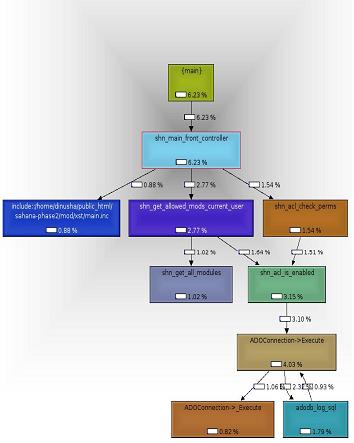
As indicated above the shn_main_front_controller () takes 6.23% of the execution time. All
notable functions within that is displayed below:

We can see that ADOdb Execute function,shn_get_all_modues() and Functions within XST module are responsible for the execution overhead.
Handler_db
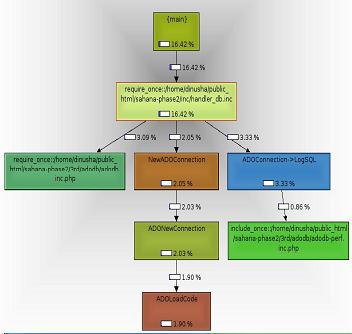
As indicated above functions within handler_db.inc takes 16.42% of the execution time. All
notable functions within that is displayed below:

We can see that most of the overhead is spent on ADOdb functions. The graph view of the
execution process is displayed below:
Handler_openid
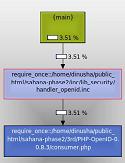
As indicated above functions within handler_openid.inc takes 4.50% of the execution time. All
notable functions within that is displayed below:
HTMLPurifier
Functions within HTMLPurifier take 44.08% of the execution time. All notable functions within
that is displayed below:
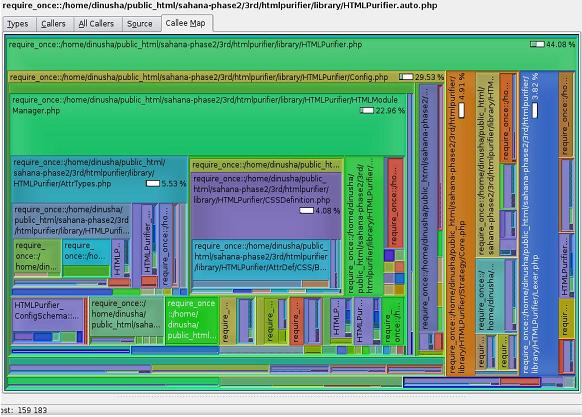
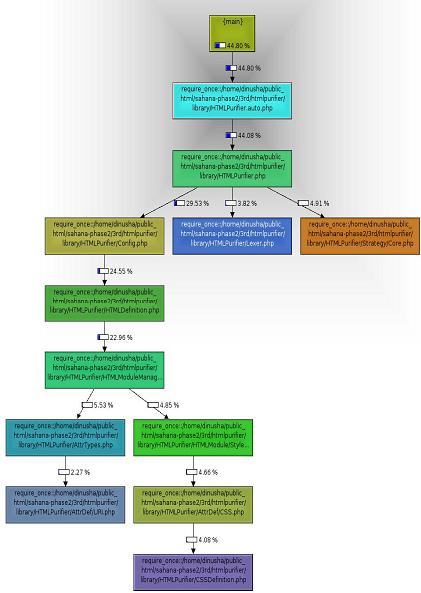
It can be seen that there are so many functions executed within html purifier. We can further
analyze this using the graph view:
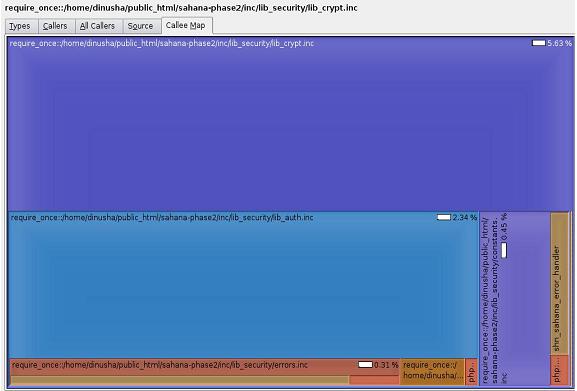
Lib_crypt
Functions within lib_crypt take 5.63% of the execution time. All notable functions within that is
displayed below
Shn_config_load_in_order
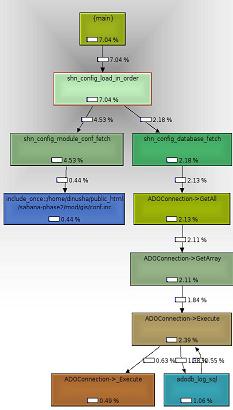
Function shn_config_load_in_order () and its children take 7.04% of the execution time. All
notable functions within that is displayed below:

We can see that the function shn_config_module_conf_fetch() is responsible for 4.53% of the
CPU time. The graph view is displayed below:
Conclusion
It is evident that HTML Purifier is taking a lot of execution time. There might be so many html violations that trigger the purifier. if we consider HTMLModuleManager.php file there are about 40 require_once which makes that thing costly. if it is possible it is better to comment some unnecessary require calls. Anyway it is not acceptable to consume about half of the computational resources for this non-functional issue. It is advisable to manually check for HTML errors before submitting page to the code base.
The time taken by the handler_db is quite acceptable since it execute a lot of queries those are mandatory to function the system properly. But most of the time is taken by ADOConnection→LogSQL() method which is not extremely important. That method logs all sql queries, time and parameters. that method can be disabled by ADOConnection→LogSQL($enable = false) command. For more information refer [[http://phplens.com/adodb/reference.functions.fnexecute.and.fncacheexecute.properties.html].
The function shn_config_module_conf_fetch() consumes considerable cpu time because it loads the conf.inc from each module. There is a while loop which makes that function costly.
